
Timberland transaction costs: survey results and insights
Timberland transaction costs: survey results and insights
Andrew Hiegel,a,* Jacek Siry,a Pete Bettinger,a and Bin Mei a
a: Warnell School of Forestry and Natural Resources, University of Georgia, Athens, GA, USA.
*Corresponding author: E-mail: andy.hiegel@uga.edu
Citation: Hiegel A., Siry J., Bettinger P., Mei B. 2022. Timberland transaction costs: survey results and insights. J.For.Bus.Res. 1(1): 21-50.
Received: 9 September 2022 / Accepted: 2 December 2022 / Published: 8 December 2022 / Updated*: 28 August 2023
Copyright: © 2022 by the authors
* In the new version of this article, Tables 9 and 10 were modified.
ABSTRACT
Timberland is a real asset that has been gaining significant attention and capital from investors over the last four decades. This paper describes and summarizes the results of a timberland investment survey conducted in early 2020. The survey polled timberland investment professionals active in the sector and provided insights into how transaction costs affect timberland investments according to the size and location of the timberland estate. Component costs were also obtained and summarized for each of the steps involved in typical timberland transactions. The survey also provided insight into investor sentiment toward timberland transaction costs as well as the process of accounting of these costs within the forest industry. Key results of the study showed differentiation in transaction costs by location and size of the timberland estates. The study also showed that transactions costs do not deter most investors from placing capital in this asset class. This manuscript provides a baseline of transaction cost information for investors and professionals interested in the timberland real asset space.
Keywords: acquisitions, appraisal, capitalization, forest economics, real assets, REIT, TIMO
INTRODUCTION
Timberland is an investment that has attracted a large share of capital from institutional investors over the last four decades (Cubbage et al. 2014; Chudy et al. 2022). This is likely due to several characteristics that include: (1) relatively low systematic risk (Mei and Clutter 2010), (2) greater diversification over other common financial assets (Binkley et al. 1996; Newell and Eves 2009), (3) long-term growth potential (Mei 2017), and (4) a positive correlation to inflation, therefore providing a hedge against inflation (Wan et al. 2013). Consequently, an increasing proportion of investment portfolio allocations have been dedicated to real assets, including timberlands, since the 1980s (Newell and Eves 2009). Transaction costs occur when exchanges are made among individuals or institutions in an economy for goods and services, including financial investments. These costs are related to collecting asset information, bargaining for terms of the transaction, inspecting the property, modelling decisions, and writing and enforcing durable contracts (Coase 1960).
Timberland transactions, like many other investments, are dependent on executing a successful transaction process. Much of the gains (or losses) in an investment are predetermined at this crucial stage (Kusewitt 1985). The price paid for an investment (the cost basis of the timberland) is only one part of several factors affecting the total costs in the transaction process (Amihud and Mendelson 2013). Transaction costs can be held independent of the total cost that will be paid for an asset. Since timberland is a complex and diverse type of asset in which to invest, transaction costs can be seen a measure of this complexity. These costs reflect the effort that is required to assess the certainty around the quality of the asset and likelihood of future cash flows that are involved. Therefore, they are an important component to track in this sector.
Limited attention has been devoted to the study of transaction costs in forestry (Hiegel et al. 2020). Some of the reasons for this deficit are that timberland transactions often occur in the private market for capital. This makes the transactions quite obscure from the public markets. Reliable information is difficult to find, and to address this deficit, therefore in 2020 a survey was conducted of experienced professionals who were actively engaged in timberland investing. Information was collected in this survey regarding absolute costs of timberland transactions, investor sentiment regarding these costs, how these costs are accounted for in the investing process, and how differences in size of land holdings, location of land holdings and type of investor might affect the costs involved in timberland investing.
In this study, the authors tested three hypotheses:
H1: Transaction costs are directly proportional to property size.
H2: Transaction costs do not vary by region.
H3: Timberland investments are affected by high transaction costs.
The remainder of this manuscript is organized as follows. The next section introduces the material and methods used to sample the target population and describes the timberland investment survey utilized. Then the survey findings are presented with the focus on transaction costs. And lastly, we provide a synthesis of the results, limitations of the study, and a summary of the key findings.
MATERIAL AND METHODS
A timberland transaction survey was developed using a Tailored Design Methodology (Dillman et al. 2014). The survey was intended for timberland professionals involved in the management or direct investment of timberland estates worldwide. The sample frame included professionals who attended timberland investment conferences that were held in 2019. The conferences targeted and the participant’s relative weighting can be found in Table 1.
Table 1. Total attendee rolls received from each conference.
|
Conference |
Number of participants |
Percentage of total |
|
The Alternative Investment Forum 2019 |
107 |
12.2 |
|
UGA Timberland Investment Conference 2019 |
439 |
49.9 |
|
Who Will Own the Forest 2019 |
334 |
38.0 |
|
All Registered Participants |
880 |
100.0 |
Survey development
Survey questions were formulated to estimate: (1) the cost of individual timberland transaction components; (2) participants’ experience with timberland transactions by timberland estate size and location; (3) participants’ views of expected timberland transaction costs depending upon timberland estate size and estate location; and (4) the impact of timberland transaction costs on timberland investing. The survey was conducted using a dedicated online solution hosted by Qualtrics International Inc. (Qualtrics 2020). A pre-test survey was conducted with a select group of six timberland investment professionals. These individuals were sent a draft survey and were asked to provide feedback given their professional background in timberland transactions. After receiving direct feedback from this group, and incorporating several of the changes suggested, the final survey was further composed. The resulting survey was developed with questions about the role that the individual performs within their organization as well as the location of their firm’s headquarters. Participants would be asked where their organization managed, invested (or intended to invest) in timberland. The survey would also include a series of questions concerning the relationship between timberland investment regions and the perceived magnitude of transaction costs within those given regions – both within the U.S. and globally. Participants would then be asked whether these regional transaction costs affect the location where their organizations would be willing to invest, whether the proportion of total transaction costs might be a function of the size of timberland estate transacted, and most importantly, whether transaction costs prevented their organization’s engagement in timberland asset sales of certain absolute sizes – large or small. Furthermore, survey participants would also be asked to rank a comprehensive list of transaction cost components that were noted in Hiegel et al. (2020) and outlined in the following equation:
TRANSACTION COSTS = BROKER COMMISSIONS + INVENTORY + AREA + GROWTH + SILVICULTURE + BUSINESS + TIMBER MARKET + LEGAL + PHASE1 + THREATENED SPP + HARVEST SCHEDULE + FINANCIAL MODEL + DEAD DEAL COSTS + PSA
where:
BROKER COMMISSIONS – fees charged by brokers to conduct the sale,
INVENTORY – forest inventory verification costs,
AREA – productive area verification costs,
GROWTH – growth and productivity verification costs,
SILVICULTURE – silviculture management verification costs,
BUSINESS – forest business management verification costs,
TIMBER MARKET – timber product market analysis and vetting costs,
LEGAL – legal records verification costs,
PHASE1 – phase 1 environmental audit costs,
THREATENED SPP – threatened species analysis costs,
HARVEST SCHEDULE – harvest schedule development costs,
FINANCIAL MODEL – financial modelling costs,
DEAD DEAL COSTS – total costs of previous unsuccessful attempts,
PSA – purchase and sale agreement.
Participants would then be asked to estimate and enumerate the total cost of each individual transaction cost component in the above equation. Lastly, the survey participants would be asked how their organizations handled the internal accounting of those transaction costs (i.e., do their organizations treat those costs as an annual expense or do they capitalize the costs into the basis of the timberland estate?).
Sample frame finalization and survey distribution
After obtaining the list of attendees to each referenced timberland investment conference (Table 1), duplicate entries to the respective lists were removed, and individuals who had attended more than one conference were identified and only counted as one participant in the sample frame. Furthermore, apparent cases of ancillary conference attendees (i.e., spouses attending with their husbands or wives) were removed from the sample frame. Finally, individuals for which no relevant contact information was provided were removed. These changes reduced the total number of conference attendees from 880 to 747. After this paring, the participants were categorized according to their specific business sector within the timberland space. Details about these timberland business sectors can be found in Table 2.
Table 2. Investment conference participants by job sector.
|
Academic: individuals working for a university either in research or a teaching capacity. |
|
Appraisal Firm: organizations that are licensed to provide timberland valuation services. |
|
Banking/Timberland Lending: traditional banks, government sponsored entities (GSEs) like farm credit service organizations, non-bank lenders like insurance companies and corporate finance groups. Broadly speaking, this group includes those that lend money to timberland investors, owners and operators. |
|
Brokerage: organizations that provide timberland and other brokerage services as part of their mission. While many different types of consulting firms also provide brokerage services, they were not included in this category. Rather, these individual brokers are included in the “Consulting Firm” and “Multi-Sector” categories. Only businesses that are brokerage firms are included in this Brokerage group. |
|
Consulting Firm: organizations that are involved in timberland management consulting. This category can include many services from direct land management to acquisition assistance to technical transfer, and others. This is a broad category of timberland professionals, and they make up a large contingent of the survey. |
|
Government: organizations that manage and administer timberland resources owned and operated by various national, state or local governments. |
|
Investor/Private Equity: organizations that invest capital into the timberland market. Wide-ranging examples include endowments, insurance companies, sovereign funds, family offices, private equity groups and individual investors. They are separated from REITs (real estate investment trusts) which are listed on public exchanges and TIMOs (timber investment management organizations) that invest others money in this asset class. |
|
Legal Firm: organizations that provide legal services for timberland transactions. |
|
Multi-Sector: organizations that can be categorized into several different sectors. A further effort was made to properly categorize this group by using the role of the survey respondent. This change can be observed by the absence of this category in Table 6. |
|
Non-Governmental Organization (NGO): organizations that promote, protect, educate others and in some cases purchase timberland. They are, essentially, those groups who are concerned about the future of timberland and do not work for government or industry. |
|
Private Timber Company (i.e., non-public): non-publicly listed timber companies that own timberland. The group includes organizations that have wood processing facilities as part of their firm. |
|
Real Estate Investment Trust (REIT): publicly investable company that invests in timberland resources and derives income from the sale of timber and related products. |
|
Private/Public Wood Product Company: organizations that exclusively process wood products. These companies don’t own timberland or have a vested interest in timberland as a source of raw materials for their wood processing and consuming industrial functions. The members of the category were not surveyed due to a lack of timberland transaction knowledge. This change can be observed by the absence of this category in Table 6. |
|
Timber Investment Management Organization (TIMO): organizations that aid investors in purchasing, managing and selling their timberland holdings. |
|
Vendor: individuals that work for organizations that supply the timberland industries. Examples would include nurseries, software companies, insurance companies and auditing firms. |
Using this categorical method, some groups were excluded from the sample frame. Namely, vendors, students, and private/publicly owned wood product companies were not included in the sample frame. This adjustment was employed to target timberland professionals that actively participate in the complete processes of timberland transactions—not just the separate components of acquisition steps or academic pursuits. After this adjustment, the list of potential survey participants was reduced from 747 to 666. Table 3 details the list of attendees by sector included in the initial survey sample frame from each conference. The largest sectors represented in this sample are employees of TIMOs (22.5%), consulting firms (11.7%), investor/private equity (15.2%), bankers (10.8%) and private timberland companies (12%)—both integrated and non-integrated.
Table 3. Attendees by sector selected to participate in the sample frame.
|
Sector |
Number of participants |
Percentage of total |
|
Academic |
13 |
2.0 |
|
Appraisal Firm |
7 |
1.1 |
|
Banking/Timberland Lending |
72 |
10.8 |
|
Brokerage |
9 |
1.4 |
|
Consulting Firm |
78 |
11.7 |
|
Government |
6 |
0.9 |
|
Investor/Private Equity |
101 |
15.2 |
|
Legal Firm |
50 |
7.5 |
|
Multi-Sector |
52 |
7.8 |
|
Non-Governmental Organization (NGO) |
25 |
3.8 |
|
Private Timberland Company (i.e., non-public) |
80 |
12.0 |
|
Real Estate Investment Trust (REIT) |
23 |
3.5 |
|
Timberland Investment Mgmt. Organization (TIMO) |
150 |
22.5 |
|
Total |
666 |
100.0 |
Table 4 shows that 79.6% of the attendees to whom surveys were emailed have their main office in North America. The second largest group (14.7%) are from Europe, and a large percentage were from the UK, Germany, and Scandinavia. Attendees from Latin America make up the last significant group to receive a survey (3.3%), and a large percentage of these were from Brazil and Uruguay.
Table 4. Attendees by region that were selected to participate in the sample frame.
|
Region |
Number of Participants |
Percentage of total |
|
Africa |
4 |
0.6 |
|
Asia |
5 |
0.8 |
|
Australia/New Zealand |
7 |
1.1 |
|
Europe |
98 |
14.7 |
|
North America |
530 |
79.6 |
|
Latin America |
22 |
3.3 |
|
Total |
666 |
100.0 |
Emails were sent to sample frame participants via the Qualtrics platform on August 25th, 2020. Following the best management practices for conducting a survey found in Dillman et al. (2014), participants were informed about the purpose of the study, they were informed that their answers and identities would remain anonymous, and they were given the number of questions (50) and the amount of time we estimated for survey completion (1 hour). A link was provided in the email invitation directing the individuals to the web-hosted survey. Lastly, a document link containing general definitions for any timberland technical term that might cause participants any confusion was provided. The survey participants were given a total of eight weeks to complete the questions. Reminders were sent out by email on a weekly basis. During the survey period, certain individuals were dropped from the sample frame because of employment changes (as evidenced by bounced emails), redundant general company email addresses (e.g., info@company.net), and other technical obstacles, bringing the ending survey frame to 650 people.
Hypothesis testing
The first hypothesis tested that was tested in the study (H1) suggested that timberland transaction costs are directly proportional to timberland estate size (i.e., the proportion of transaction costs stays constant across estate size classes as a percentage of total timberland value). To test this hypothesis from the survey results received, a one-way ANOVA was applied using JMP Pro 16 software (version 16.0.0, SAS Institute Inc., Cary, NC, USA).
The second hypothesis that was tested (H2) suggested that transaction costs do not differ by region. Using the regional cost estimate results from the survey on U.S. regions only, a Chi-square test was applied using JMP Pro 16 software (version 16.0.0, SAS Institute Inc., Cary, NC, USA). A Fisher's Exact Test was utilized using the results from all the other global regions. Fisher’s Exact Test was utilized in this instance because the total number of survey responses for global regions did not fully meet the assumptions of a Chi-square test. A Chi-square test relies on a larger sample to meet its specific requirements. This Fishers Exact Test was applied using STATA statical software (version 17.0, StataCorp, College Station, TX, USA).
The third hypothesis that was tested (H3) suggested that high transaction costs affect timberland investment decisions. This hypothesis was tested using the regional timberland results from the survey that asked participants to (a) estimate regional transaction costs and (b) report the effects of those costs. To these results, a Hypothesis Test for a Proportion was also applied using JMP Pro 16 Software (version 16.0.0, SAS Institute Inc., Cary, NC, USA).
RESULTS
Survey response rates
Using the sample frame developed, 102 responses were received, yielding a response rate of 15.7%. Most survey respondents (63.5%) were affiliated with either TIMOs, consulting firms, or timberland management companies (both publicly and privately held), as seen in Table 5. The highest response rates from an individual category were from brokerage firms (23.5%). Appraisal firms also accounted for 15.4% of the survey respondents. Thus, the two broader groupings of the survey that provided the most information were timberland managers (63.5%) and those concerned directly with timberland valuation—brokers and appraisers (38.9%).
Table 5. Survey respondents by timberland industry sector.
|
Industry sector |
Total percentage response by job sector |
|
Academic |
15.4 |
|
Appraisal Firm |
15.4 |
|
Banking/Timberland Lending |
7.4 |
|
Brokerage |
23.5 |
|
Consulting Firm |
20.7 |
|
Government |
0.0 |
|
Investor/Private Equity |
7.9 |
|
Legal Firm |
8.0 |
|
Non-Governmental Organization (NGO) |
8.0 |
|
Private Timberland Company (i.e., non-public) |
21.4 |
|
Real Estate Investment Trust (REIT) |
9.1 |
|
Timberland Investment Management Organization (TIMO) |
12.3 |
|
Total |
13.2* |
*Not all survey participants disclosed their current industry sector.
The survey respondents held several different professional roles within their respective organizations (Figure 1). Participants were asked to specify their role directly; however, only 82 of the individuals responding reported the role they serve in their organization. A sizeable majority of respondents served roles in acquisitions and dispositions within their organization. Executives and directors also constitute a large contingent of the respondents, and if added to the acquisitions group, the total constitutes more than 60% of survey respondents.
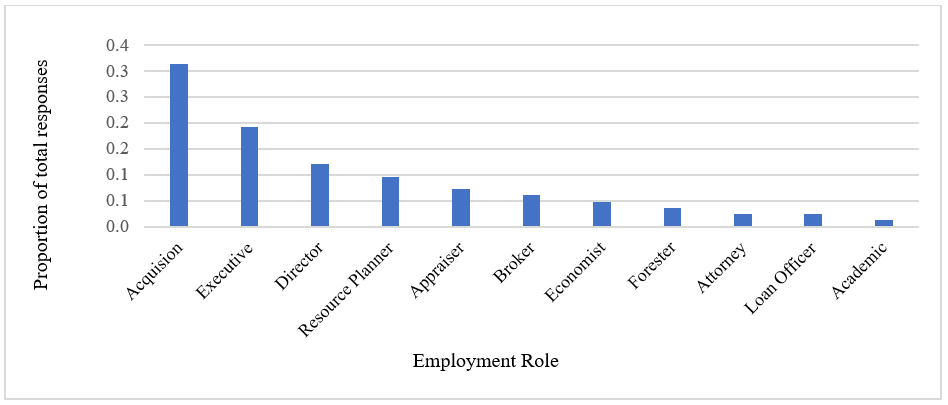
Figure 1. Survey respondents’ role within their organization.
Geographically, and based on the number of potential respondents in each region, the highest response rates (Table 6) were from members of organizations based in Latin America (22.7%) and North America (13.8%). This categorization was based on where the respondent’s main office is located. Unfortunately, no responses were received from people who worked in Oceania, Asia, and Africa. This is likely due to the smaller number of timberland investors headquartered in these parts of the world. Therefore, these regional groups were not well sampled by using US/Europe-based conference attendance roles.
Table 6. Survey responses by head office region.
|
Region |
Responses |
Percentage of total surveys deployed |
Percentage of total response rates |
|
Africa |
0 |
0.6 |
0 |
|
Asia |
0 |
0.8 |
0 |
|
Oceania (Australia/New Zealand) |
0 |
1.1 |
0 |
|
Europe |
12 |
14.7 |
12.2 |
|
North America |
73 |
79.6 |
13.8 |
|
Latin America |
5 |
3.3 |
22.7 |
|
Total |
90* |
100.0 |
13.5 |
*Not all survey participants disclosed their head office location.
Enumeration and sum of total transaction costs by due diligence function
Survey participants were also asked to provide both specific transaction costs (per unit area) of specific components of a timberland transaction and an estimate of overall component costs relative to the total value of the timberland being exchanged. Some of the costs were not asked for, nor enumerated, because the variability in the manner in which those costs are handled by different organizations was too great. An example of this would be dead deal costs. Dead deal costs are a function of how many attempts were made to purchase timberland assets before a successful attempt was negotiated and completed. These dead deal costs are difficult to calculate because the number attributable to a single transaction (and specific investor) can be completely arbitrary. In the case of a TIMO, several different investors may be trying to invest in the same property. Therefore, the TIMO would have to decide to whom the dead deal cost should be attributed and charged. Furthermore, brokerage costs were not requested in terms of costs per unit area. Instead, they were requested as a percentage of total timberland value. That is why brokerage costs were also excluded from the total average component costs. The results regarding specific components of transaction costs per hectare can be found in Table 7. As the numbers indicate, there is a large difference in transaction costs reported in U.S.-based and non-U.S.-based transaction costs for timberland transactions.
Table 7. Reported timberland transaction component costs for U.S. and non-U.S. estate sales.
|
|
Reported cost inside the U.S. (USD/hectare) |
Reported cost outside of the U.S. (USD/hectare) |
||||
|
Transaction cost category |
Average |
Minimum |
Maximum |
Average |
Minimum |
Maximum |
|
Inventory verification (INVENTORY) |
1.94 |
0.08 |
6.07 |
2.80 |
0.40 |
8.90 |
|
Productive hectares (AREA) |
0.37 |
0.04 |
1.62 |
2.47 |
0.20 |
8.90 |
|
Growth & yield (GROWTH) |
0.14 |
0.04 |
0.40 |
0.23 |
0.10 |
0.40 |
|
Forest management costs (SILVICULTURE + BUSINESS) |
0.14 |
0.00 |
0.40 |
0.07 |
0.02 |
0.10 |
|
Market price forecast development (TIMBER MARKET) |
0.15 |
0.02 |
0.40 |
0.50 |
0.02 |
1.98 |
|
Lands records (LEGAL) |
0.58 |
0.02 |
1.21 |
1.06 |
0.06 |
2.43 |
|
Legal counsel (PSA) |
0.89 |
0.12 |
2.02 |
1.08 |
0.12 |
2.17 |
|
Environmental issues (PHASE 1 + THREATENED SPP) |
0.35 |
0.04 |
0.81 |
0.53 |
0.04 |
1.21 |
|
Harvest scheduling |
0.36 |
0.04 |
2.02 |
1.27 |
0.06 |
1.98 |
|
Sum of average reported costs |
$4.93 |
- |
- |
$10.02 |
- |
- |
Participants were also asked to rank components of transaction processes in terms of time and money spent (Table 8). Inventory verification topped the list of transaction costs in both geographic areas (the U.S. and non-U.S.). Productive area verification was listed as a much higher cost component in areas outside of the U.S. relative to other transaction costs. Another difference between the two regions can be seen in the ranking of legal costs. Inside the U.S., legal costs are ranked much higher relative to non-U.S.-based properties.
Table 8. Respondent’s ranking of transaction costs from 1 to 11.
|
Rank (highest to lowest)* |
||
|
Transaction cost components |
U.S. |
non-U.S. |
|
Inventory verification |
1 |
1 |
|
Legal issues (including purchase and sale agreement) |
2 |
4 |
|
Growth-and-yield |
3 |
3 |
|
Harvest schedule development |
4 |
5 |
|
Productive area verification |
5 |
2 |
|
Lands records verification |
6 |
6 |
|
Environmental issues due diligence |
7 |
8 |
|
Brokerage fees |
8 |
10 |
|
Price forecast development |
9 |
9 |
|
Forest management cost itemization |
10 |
7 |
|
Dead deal costs |
11 |
11 |
*Number one is considered the highest cost and number eleven the lowest.
Transaction costs by timberland estate size
Participants were also asked to estimate how much was spent on transaction costs for several ranges of timberland estate sizes. Specifically, they were asked to provide a transaction cost number as a percentage of total timberland value for five different hypothetical estate sizes. Figure 2 and Table 9 show average estimates for transaction costs accounted for no more than 3.17% of the smallest estate sizes (approximately 2,000-4,000 ha). Whereas, for estates that were more than around 40,500 ha, the estimates for average total transaction costs did not total more than 1.34% of the estate's total value. In Figure 2, the boxplot indicates an inverse relationship between timberland size and the proportional cost of timberland transaction costs. As can be seen from this data, transaction costs of larger estate decrease in relation to total estate value.
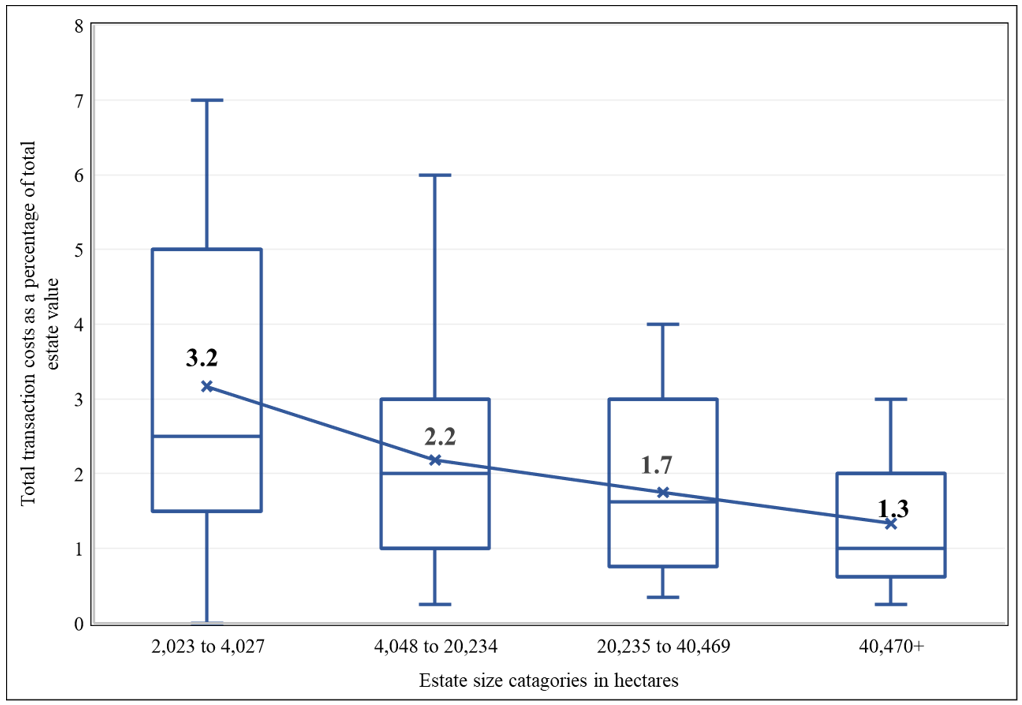
Figure 2. Transaction costs as a percentage of total timberland estate value.
Table 9. Transaction costs as a percentage of total timberland estate value.
|
Estate size (hectares)* |
2,023 to 4,047 |
4,048 to 20,234 |
20,235 to 40,469 |
40,470+ |
|
Average total transaction cost |
3.17 |
2.18 |
1.75 |
1.34 |
|
Reported cost range |
0.002 - 7.00 |
0.25 - 6.00 |
0.35 - 4.00 |
0.25 - 3.00 |
|
Median |
2.50 |
2.00 |
1.63 |
1.00 |
|
95 % confidence interval |
± 0.75 |
± 0.58 |
± 0.45 |
± 0.35 |
*Note: Categories were not rounded since these transaction costs were originally surveyed on a per acre basis.
Regional comparisons of transaction costs
The survey also explored perceived transaction costs and whether investors’ perceptions about those costs affected their ongoing timberland investment decisions. These questions were region specific and relational. As shown in Figure 3, the survey’s respondents perceive that the U.S. Pacific Northwest and the U.S. Northeast have the highest transaction costs. Also, the survey showed that the U.S. Southeast Atlantic and South-Central regions had the lowest perceived transaction costs among all U.S. regions.
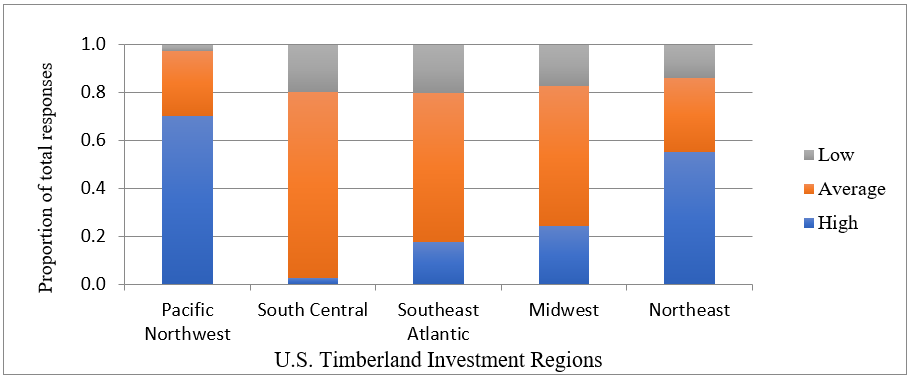
Figure 3. Perceived transaction cost by U.S. timberland region.
Most participants responded that transaction costs do not generally affect where they choose to place their U.S. regional investments (Figure 4).
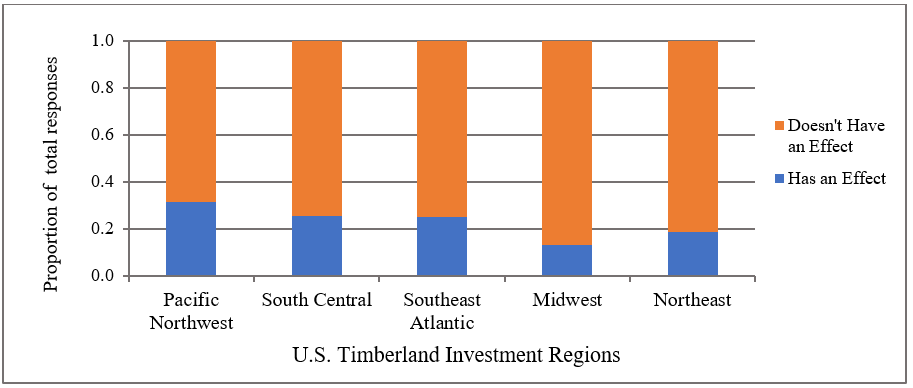
Figure 4. Differential effect of transaction costs on U.S. regional timberland investment.
As can be seen in Figure 5, respondents perceived Latin America, Europe, and Oceania as equally expensive in their respective transaction costs. Survey participants in this case were more likely to forgo timberland investments in regions they perceive as having relatively high transaction costs (e.g., Oceania and Asia).
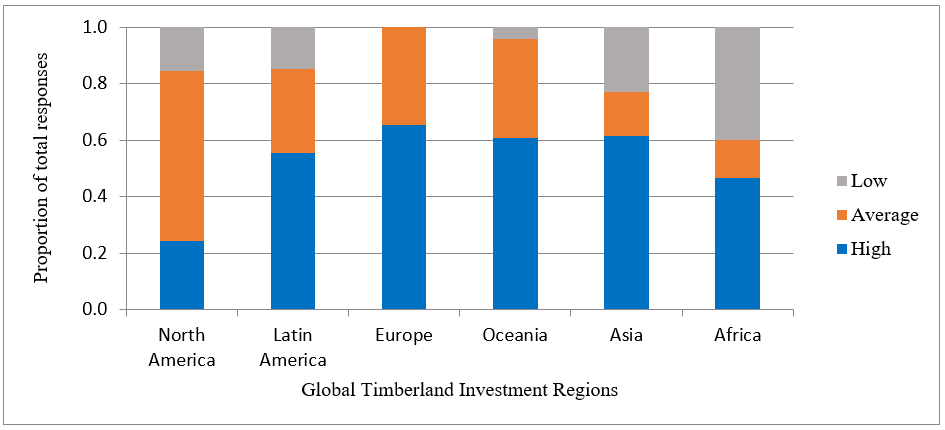
Figure 5. Perceived transaction cost by global timberland regions.
However, globally, participants suggested that transaction costs do not generally affect the location where they choose to place their capital, as can be observed in Figure 6.
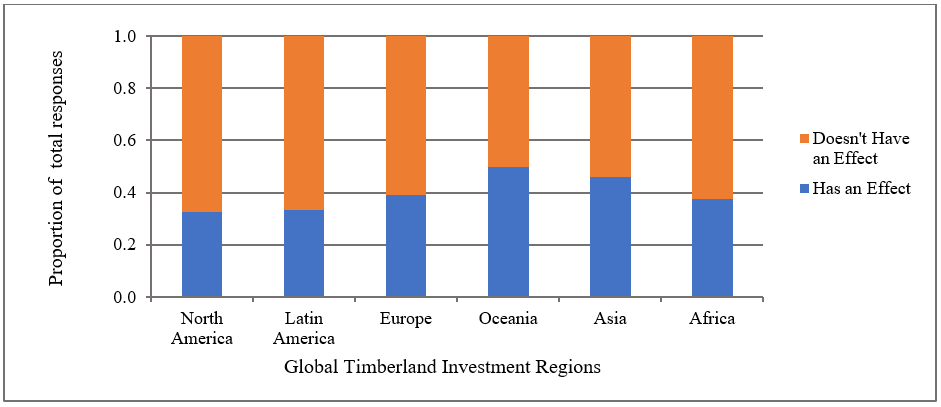
Figure 6. Differential effect of transaction costs on global investments.
The survey also explored perceived differences of individual component transaction costs in several geographic investment regions. Survey participants ranked component costs by regions both within the U.S. and globally. These responses provide a glimpse of the individual transaction cost components perceived as relatively more expensive in one region than another (Figure 7). These results indicate that survey participants perceived that the due diligence costs of: (1) environmental issues; (2) productive area determination; (3) harvest scheduling; and (4) forest management cost determination stand out as particularly high costs for lands located in the Pacific Northwest. Therefore, the total cost of due diligence seemed most concerning particularly in the U.S. Pacific Northwest.
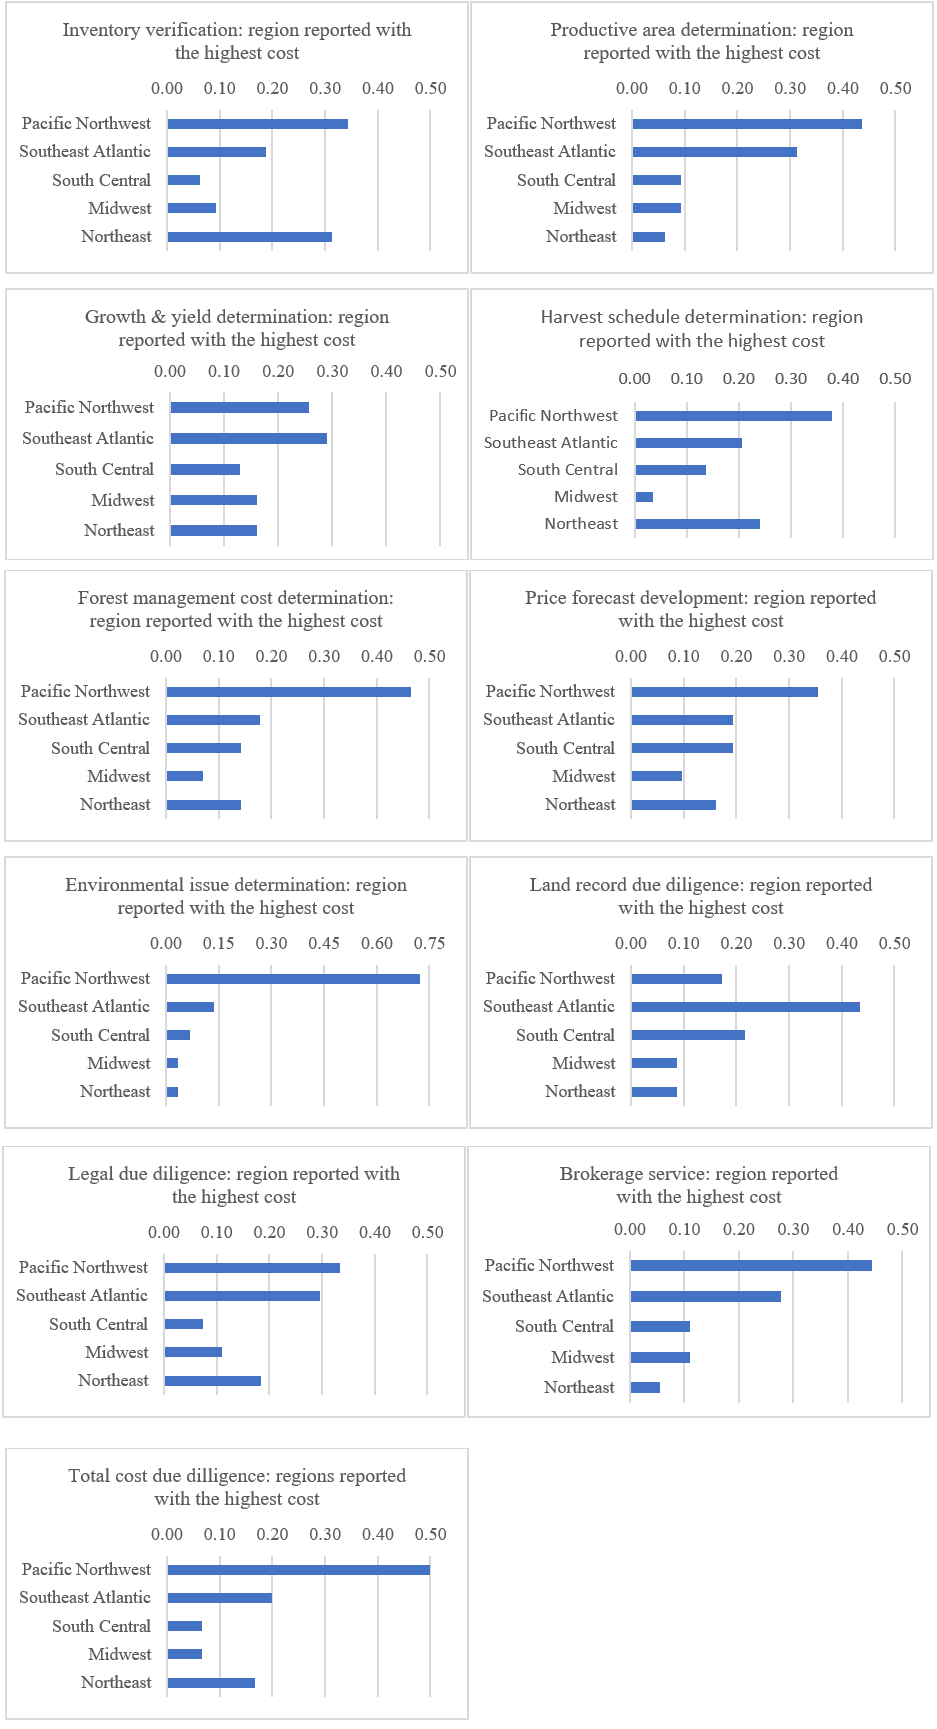
Figure 7. U.S. transaction costs ranked by region and type as a proportion of survey responses.
From a larger, global perspective, Latin American timberland transaction costs seem to cause the most concern judging from survey responses (Figure 8). When considering individual component costs, this concern can be observed: (1) in the productive area verification; (2) lands records: and (3) legal cost components of transaction due diligence. Latin America also seems to have particularly high cost of securing appropriate land records for due diligence. As can be observed in Figure 8.
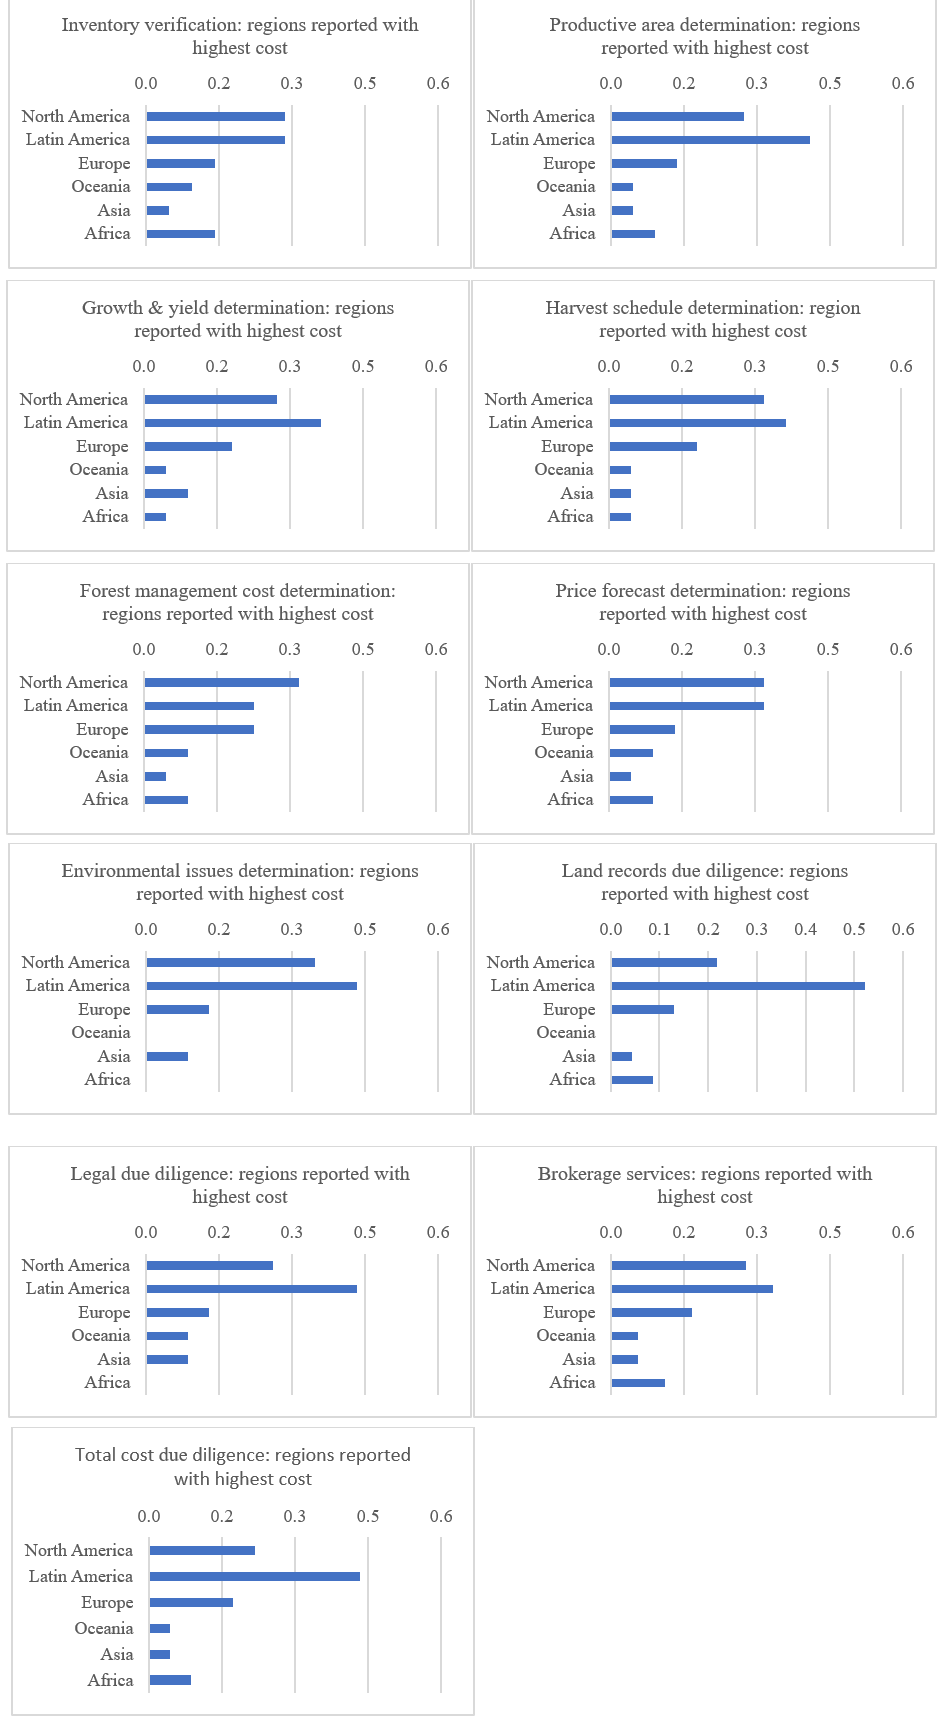
Figure 8. Global transaction costs ranked by region and type as a proportion of survey responses.
Attribution of transaction costs among timberland investors
The survey also explored how organizations specifically account for (and charge) these costs in their client fee structures. What can be seen from the survey responses (Figure 9) is that transaction costs are well known in the timberland investment sector and are also diligently accounted for when capital is deployed on behalf of investors. Dead deal costs were of particular interest in this survey as they can be quite expensive over time, as seen by how closely they are tracked by investors (Figure 9).
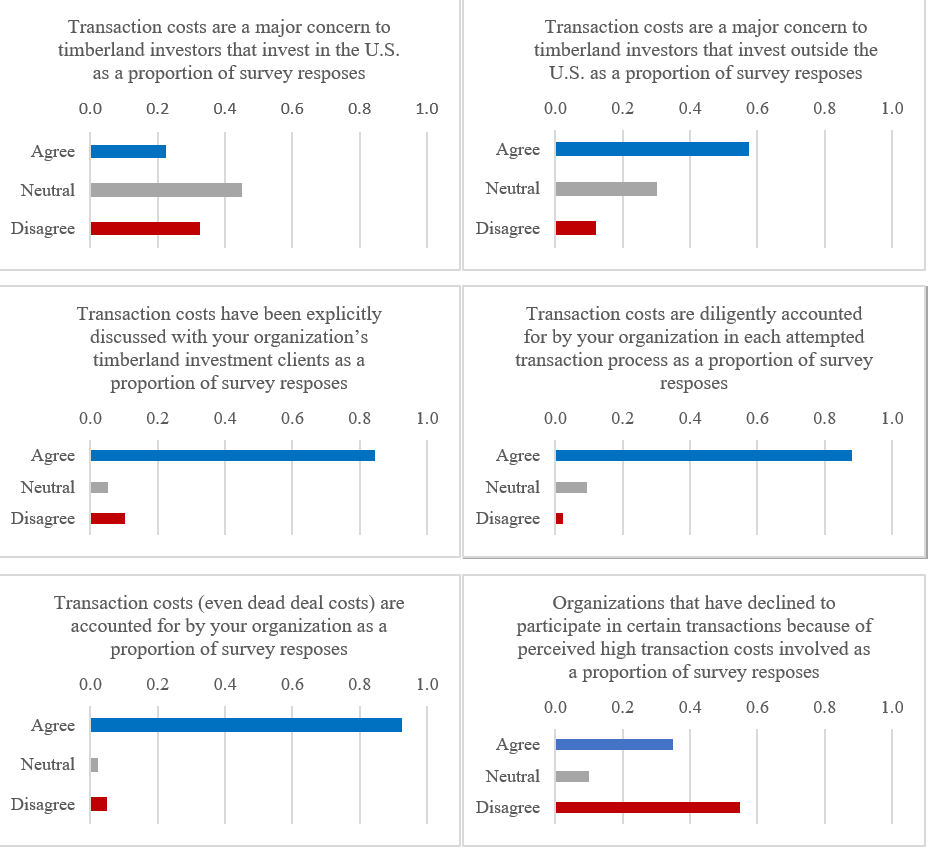
Figure 9. How survey respondents consider different aspects of timberland transaction costs.
It could also be observed from Figures 10 and 11 that organizations treat these transaction costs very differently. While most organizations capitalize transaction costs into the basis of the timberland investment, others treat those transaction costs as an annual line-item expense1. This line-item expense is then billed to their clients directly and not included in the investment basis. Some organizations also do not pass these costs on to their clients at all, as they consider these costs an internal expense to their own businesses.
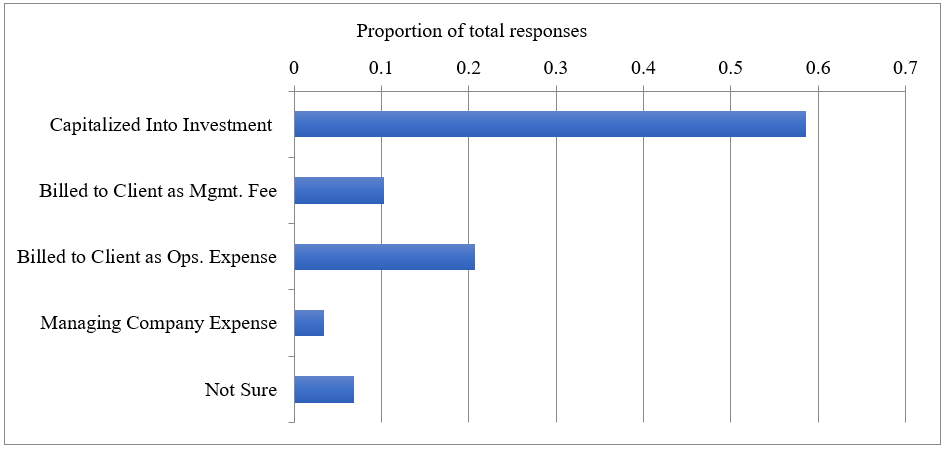
Figure 10. Survey responses to how organizations handle timberland transaction costs.
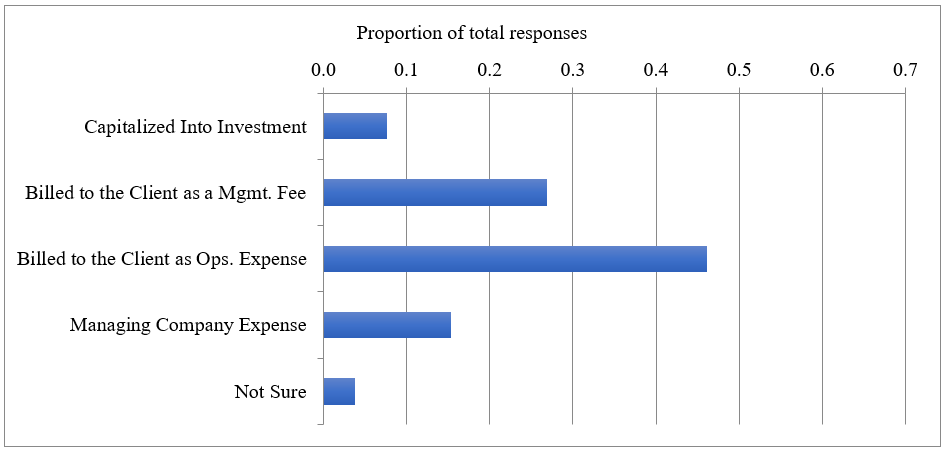
Figure 11. How respondents’ organizations handle timberland dead deal costs.
Hypothesis testing results
As noted in the methods section, the first hypothesis tested (H1) suggested that timberland transaction costs are directly proportional to timberland estate size (i.e., the proportion of transaction costs stays constant across estate size classes as a percentage of total timberland value). The timberland transaction cost estimates provided by the survey participants in a range of different estate size classes were found to be significantly different from one another, with p-values less than 0.05 (Figure 2). Therefore, the null hypothesis was rejected. Timberland transaction costs were not found to be directly proportional across timberland estate sizes (Table 10).
Table 10. Summary results of study hypothesis testing.
|
Hypothesis |
Test |
p-value |
Result |
|
|
H1: Timberland transaction costs are directly proportional to timberland estate size |
|
|||
|
|
ANOVA |
p < 0.0001 |
Reject H1 |
|
|
H2: Transaction costs do not differ by region |
|
|||
|
U.S. non-U.S. |
Pearson Chi-Square Fisher’s Exact |
p < 0.0001 p < 0.001 |
Reject H2 Reject H2 |
|
|
H3: High transaction costs affect timberland investment decisions |
|
|||
|
U.S. non-U.S. |
Hypothesis Test for a proportion |
p < 0.0001 p = 0.0378 |
Reject H3 Reject H3 |
|
The second hypothesis tested (H2) suggested that transaction costs do not differ by region. Regional cost estimate results from the survey were utilized for both U.S. and worldwide regions. The regional transaction cost estimates tested in both cases were found to be significantly different from one another, with p-values less than 0.05 (Figures 3 and 5). Therefore, the null hypothesis was rejected. Timberland transaction costs were different in different regions.
The third hypothesis tested (H3) suggested that high transaction costs affect timberland investment decisions. This hypothesis was tested using the regional timberland results from the survey that asked participants to estimate regional transaction costs and then asked them to report the effects of those costs. This analysis showed that of all the timberland regions in the U.S. and globally surveyed, only a limited number of participants were swayed by transaction costs in their regional investment decisions. Those regions affected included Oceania, Africa, and Asia. Most participants surveyed reported that their investment decisions in all other regions were not affected by high transaction costs. Therefore, the null hypothesis can be rejected. High transaction costs were not found to affect timberland investing in the majority of U.S. and global regional markets.
DISCUSSION AND CONCLUSIONS
This study set out to accomplish four tasks: (1) to explore the variation in transaction costs for timberlands that vary in total estate sizes; (2) to explore the variation in transaction costs for timberlands that are located in different regions; (3) to understand how transaction costs are being accounted for within the investment structures, and ultimately; and (4) to determine if the extent and magnitude of these costs are having an impact on timberland investments. Statistically significant differences in the responses were discovered in the timberland transaction costs that were dependent on estate size and location. Furthermore, timberland investment organizations represented in the survey accounted for transaction costs differently, and most did not capitalize costs into the investments they managed. Therefore, the extent of those transaction costs would not directly affect the calculated returns of the timberland investments. This simple step of accounting could help explain the lack of direct evidence that transaction costs could affect investors in their choice of investment decisions. Recall that this survey, though able to uncover important differences in transaction cost between estate sizes, investment regions, and accounting preferences, was not able to find a significant effect of those costs on timberland investment decisions.
While there are other academic studies have emphasized the importance of transaction costs in commercial real estate, much of the research on transaction costs in this sector has focused on organizational structure of the firms involved and not on calculating total empirical costs. This study was designed to address this void. Another focus of transaction costs in the commercial real estate sector has been on residential real estate. Although interesting and important, this type of real estate may not have many direct parallels to professional timberland investing. As an example, Bian et al. (2016) studied the role of transaction costs in impeding market exchange in residential real estate. The authors focus on how transaction costs can prolong time to final closing (or time on market). Also, Nozeman (2010) studied the transaction cost differences in commercial real estate among several European Union countries, where the focus was on transfer tax payments as a proxy for total transaction costs. While neither manuscript was looking to empirically calculate the total transaction costs involved, both studies acknowledged a lack of research in transaction costs and the importance these costs can have in real asset investing.
Results related to Hypothesis 1 of this study point to an inverse relationship between timberland estate sizes and proportional transaction costs. Specifically, when considering transaction costs on a relative basis (i.e., cost per unit area), larger timberland estates seem to provide for an economy of scale when investing. Logically, the differences in transaction costs between larger and smaller estates are directly attributable to the diligence components that all timberland transactions require. This implies that there are fixed and sunk costs that must be paid in timberland investing (i.e., transaction costs) regardless of the total estate size. An example of this would be the negotiation of a timberland purchase and sale agreement (PSA). This legal step that must be accomplished in any transaction takes time and legal fees, some of which can be viewed as fixed, regardless of the size of the estate. This type of unavoidable costs, as well as others that are involved in the process, would tend to make the transaction costs of smaller estates more expensive on a relative basis.
Furthermore, the results of the study related to Hypothesis 2 highlight the regional differences encountered when investing in timberland estates. Specifically, a timberland investor would encounter variability with regional transaction costs, and some of the differentiating factors in these costs can be explained by geography, infrastructure, localized legal regimes, and environmental risk factors. For example, a region that has steep topography may have limited points to access the timberland. In these areas, ensuring legal access and proper infrastructure (e.g., roads, bridges, etc.) is paramount and would require a higher level of transaction diligence, therefore higher transaction costs. Also, legal and permitting regimes can directly affect the cost of transaction diligence. Complexities related to activity permitting (e.g., road, harvesting, environmental wavers, etc.), obtaining land records, and safeguarding ownership rights in certain timberland regions may add significantly to the transaction cost differentiation. Lastly, timberland investments may reside in regions with significantly greater risk factors, requiring a higher level of transaction due diligence. Examples would include fire risks, insect or disease risks, and political risks. Logically, the examples above show that the cost of diligence will vary by region.
The study exposed a stark contrast between several commercially important timberland regions in the United States and their respective transaction costs. The Pacific Northwest, the South Central and the Southeast Atlantic regions represent some of the most productive and investable timberlands in the U.S. The Pacific Northwest is considered the most expensive region of all U.S. regions to conduct timberland transactions. As an extreme counterpoint, the South Central (and to a somewhat lesser extent in the Southeast Atlantic) have much a lower cost of transacting. These differences are attributable to several important factors. Specifically, the Pacific Northwest has more extreme topography, more state-level forest practice regulations, more limitations to legal (and functional) timberland access points, and more volatile export log markets. The natural outcome of these differences is an increase in transaction costs which were established in the study’s results. The full implications of these regional differences cannot be fully explored here, but it is hard to image that such differences would have a trivial effect on timberland investments that occur within these three active investment regions.
Although the null hypothesis was rejected in the case of Hypothesis 3, which suggested that high transaction costs affect timberland investment decisions, the results of this study did not show a zero effect. Clearly, a minority of respondents reported transaction costs influencing their timberland investment decisions, as can be observed in Figures 4 and 6. For investments in differing timberland regions with variabilities in the magnitudes and complexities involved, the amount of transaction diligence will always be at the discretion and judgement of the individual investor. However, the survey results demonstrate that transaction costs do not appear to inhibit investment activity. For example, more than 63.3% of respondents reported no constraint (or cost cap) in transaction costs that prevented their organization from pursuing timberland in the U.S. or other regions globally. Also, nearly 63.1% of respondents reported that transaction costs did not affect the timberland size their organization was targeting for investment. The survey demonstrated that transaction costs are not an inhibiting factor either by timberland region or by a matter of timberland scale. Some of this result may be attributable to the sample frame, as investors specializing in various types of non-timber-related financial investments were not surveyed. A more comprehensive sample frame of all investment professionals may be necessary to discover if transaction costs prevent this larger group from investing in the asset. As noted, this survey targeted investment professionals in the timberland investment community about barriers to investing in that asset class. This was done purposefully, but it is not immune to selection bias. These investment professionals have already decided that timberland is a desirable investment class and most likely have a professional bias and vested interest in the sector’s success. So, it is not surprising that the majority would report that transaction costs are not a barrier to entry into that class.
Participants in the survey were also asked to explain their respective organizations accounted for transaction costs among their timberland investors. This was the study’s attempt to better understand how bookkeeping might affect timberland investments. From the survey results, less than 60% of organizations are capitalizing on the total transaction costs on the timberland acquisition basis. In other words, they are not treating transaction costs as part of the original timberland investment. The effect of this accounting practice is that the transaction costs for these specific estates do not directly affect their investment returns. This accounting practice makes timberland investing more attractive to the buyer but more costly for the organization responsible for the diligence on the timberland (i.e., the TIMOs). This practice raises the question of whether TIMOs and other management organizations recapture these costs in their ongoing management fees. Also, dead deal costs, the costs of all the due diligence (i.e., transaction cost) efforts from previous deals that fell through, could make investments look more attractive on paper. As seen in the survey, less than 10% of organizations are capitalizing on those dead deal costs on the timberland estate basis. These dead deal costs can be extensive, as many organizations attempting to invest in this space are successful only a handful of total attempts (e.g., possibly just a 10% success rate according to the authors’ experience).
Limitations of this study included the somewhat narrow survey frame that was developed. In addition, the conferences utilized to select survey participation were limited to those offered in North America and Europe. Recent global conferences and professional timberland investment meetings were not discovered during the development of the survey. Expanding the reach of this sample frame in the future would be an improvement and lead to a more in-depth global timberland investor survey. To the extent that the authors would have had access to these international investors, their input could have been better represented, and those inputs would have been included. Also, although every effort was made to include a large survey frame of professionals, limited time and individual firm confidentiality rules resulted in lower survey participation than was anticipated.
Further study and analysis would be welcome in exploring how these costs are incorporated into the return averages for this investment class and others. For example, transaction cost comparisons to the regional NCREIF Timberland Property Index (TPI) and other real-asset indices could and should be conducted. The TPI has been tracking timberland returns since 1987 and is what many consider the standard to compare regional timberland investment returns (Mei 2017). Further work could include exploring transaction costs in different regions among different real asset classes. This comparison could explore different estate sizes and regions and determine if the transaction costs correlate to better or worse results in real asset investing. This investigation would be a useful comparison since this range of real assets compete for limited capital and could empirically provide a better understanding of performance amongst these real asset classes and their respective transaction costs.
Another area of further exploration could and should involve timberland investing for the purpose of carbon capture and the effect on timberland transaction costs. Timberland transactions involving marginally productive forests have become increasingly common in the timberland investment sector. Several recent timberland investors have stated that their investment has more to do with sustainability goals, ESG, or carbon reduction commitments than traditional cash flow targets. In the case of investing for the benefit of future carbon credit revenue streams, it would be interesting to see how conservation easements might affect the due diligence, negotiation, and legal costs. The authors leave this topic for future research, as it was not the subject of the 2020 survey nor the focus of our current work.
This study was conducted to discover the magnitude extent that transaction costs were influencing the existing practice of timberland real asset investing. By conducting a detailed survey of timberland investment professionals, the study attempted to discover attitudes and practices in acquisitions and dispositions involving timberland estates. From the survey, it has become evident that transaction costs affect estates differently regarding their size, location, and impact on investments. It was also shown from the survey results that investors are being made aware of transaction costs during the timberland acquisition process, and attempts are being made by participants to track those costs with the framework of the investment. What is unclear is whether the full extent of those transaction costs is being tracked and accounted for within the internal processes of an organization. These transaction costs are complex, multi-layered, and affect how labor is allocated within a firm, as Coase (1937) and Williamson (1981) revealed. Therefore, although this study illustrates the magnitude of practices related to transaction costs worldwide, it would be necessary to further directly investigate the total effort and energy of organizations involved to fully understand total cost of their due diligence.
ACKNOWLEDGMENTS
This research was supported by the United States Department of Agriculture Food and Agricultural Sciences National Needs Graduate Grants Program (NIFA grant 2015–10780).
CONFLICT OF INTERESTS
The authors declare no conflict of interest.
REFERENCES CITED
Amihud Y, Mendelson H. 2013. Transaction costs and asset management. In: Pinedo M, and Walter I. (eds). Global asset management: strategies, risks, processes, and technologies. Palgrave Macmillan UK, London pp. 414-432.
Bian X, Waller B, Wentland S. 2016. The role of transaction costs in impeding market exhange in real estate. Journal of Housing Research. 25 (2): 115-136.
Binkley CS, Raper CF, Washburn CL. 1996. Institutional ownership of US timberland: History, rationale, and implications for forest management. Journal of Forestry 94 (9): 21-28.
Chudy R, Mei B, Skjerstad S. 2022. The performance of private equity timberland funds in the United States between 1985 and 2018. Journal of Forest Economics 37(2):199-215.
Coase RH. 1937. The nature of the firm. Economica 4 (16): 386-405.
Coase RH. 1960. The problem of social cost. The Journal of Law & Economics 3: 1-44.
Cubbage F, Donagh P Mac, Balmelli G, Olmos VM, Bussoni A, Rubilar R, Torre RD La, Lord R, Huang J, Hoeflich VA, et al. 2014. Global timber investments and trends, 2005-2011. New Zeal J For Sci. 44(Suppl 1):2005–2011. doi:10.1186/1179-5395-44-S1-S7.
Dillman DA, Smyth JD, Christian LM. 2014. Internet, phone, mail, and mixed-mode surveys: the tailored design method. Fourth edition., John Wiley & Sons, New York. 464 p.
Hiegel A, Siry J, Bettinger P, Mei B. 2020. Timberland transaction costs and due diligence: a literature review and assessment of research needs. International Forestry Review 22 (2): 199-210.
Kusewitt JB. 1985. An exploratory study of strategic acquisition factors relating to performance. Strategic Management Journal 6 (2): 151-169.
Mei B. 2017. Investment returns of US commercial timberland: insights into index construction methods and results. Canadian Journal of Forest Research 47 (2): 226-233.
Mei B, Clutter ML. 2010. Evaluating the financial performance of timberland investments in the United States. Forest Science 56 (5): 421-428.
Newell G, Eves C. 2009. The role of U.S. timberland in real estate portfolios. The Journal of Real Estate Portfolio Management 15 (1): 95-106.
Nozeman E. 2010. Transaction costs in commercial real estate: A European comparison.” In 17th Annual European Real Estate Society Conference. ERES: Conference. Milan, Italy, 2010.
Qualtrics. 2020. Accessed from: https://www.qualtrics.com
Wan Y, Mei B, Clutter ML, Siry JP. 2013. Assessing the inflation hedging ability of timberland assets in the United States. Forest Science 59 (1): 93-104.
Williamson OE. 1981. The economics of organization: The transaction cost approach. American Journal of Sociology 87 (3): 548-577.
FOOTNOTES
1 an appropriation that is itemized on a separate line in a budget